Meteorology is the science of the atmosphere. It takes its name from the Greek word "meteoron" - meaning 'something that happens high in the sky'. The ancient Greeks observed clouds, winds, and rain and tried to understand how they are connected to one another. The weather was important in their relatively simple society because it affected the farmers who raised their food and their seamen who sailed the oceans.
Today, the ancient science of meteorology has matured. It is at the cutting edge of research, seeking answers to basic questions about the world around us and working to develop applications that are critically important to our lives and the lives of our children and grandchildren.
On this page you'll find links to a wealth of weather related material that will help you learn more about this fascinating science. Most links go to web pages on the fantastic Australian Bureau of Meteorology web site. As we find more weather learning material we'll add them here.
On this page:
| Australia's First Weathermen | Automatic Weather Stations | Barometer | Barometric Pressure | Bushfire Weather | Climate & Weather | Climates of the World | Clouds | Conversion Calculators | El Nino | Facts & Figures | Forecasting the Weather | Green House Effect | Indigenous Weather | La Nina | Meteorology & Sport | Ozone |
Severe Weather Events | Storm Spotters | Urban Design & Climate | The Weather Map | Weather Forecast Terms ||
|
The Bureau of Meteorology issued its first weather forecast on 1 January 1908. Observations of weather conditions around Australia were made by Cook, Dampier and other early navigators. However, the first land-based observations were made by William Dawes, a lieutenant in the Royal Marines who arrived with the First Fleet in 1788. He built an observatory at Sydney Cove and for the next three years kept daily records of the wind, temperature, pressure and rainfall. Lean more... |
|
|
|
Automatic Weather Stations (AWS) The Bureau of Meteorology operates a network of over 550 Automatic Weather Stations (AWS) across Australia. The AWS are designed to serve the dual purposes of providing real-time data for the Bureau's forecasting, warning, and information services, as well as high quality data for the Bureau's climate database. While the advantages of installing an AWS may be obvious, there are also some disadvantages. Lean more... |
|
|
|
A barometer is an instrument for measuring the pressure of the air, due to the weight of the column of air above it. As the earth's atmosphere gets thinner with increasing height, it follows that as we ascend from sea level and low-lying parts of the earth's surface, the weight of the air will decrease. That is, the pressure will fall. Lean more... |
|
|
|
Barometric Pressure - High and Low Regions of sinking air are called highs, high pressure regions or anticyclones. Clear skies and fair weather usually occur in these regions. Regions of rising air are called lows, low pressure regions, depressions or cyclones. Clouds rain and strong winds often occur in these regions. Lean more... |
|
|
|
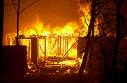
Australia has a history of severe bushfires. Such tragedies as the Ash Wednesday fires of February 1983 (71 deaths in Victoria and South Australia), the Tasmanian fires of February 1967 (62 lives, more than 1400 houses and buildings lost), the New South Wales bushfires of 1994 and the 2003 Canberra bushfires (which killed 3 and destroyed over 500 homes), place bushfires high on the list of Australia's natural disasters. Lean more... |
|
|
|
Climate and Weather - what's the difference? Climate is what you expect; weather is what you get. Climate is about long-term records, trends and averages; weather is the day to day experience. Climate is the sum or synthesis of all the weather recorded over a long period of time. It tells us the average or most common conditions, or extremes, or counts of events, or frequencies. Weather is a description of conditions over a short period of time - a "snap shot" of the atmosphere at a particular time. If weather is the watch then climate is the calendar. |
|
|
|
Visit the Macquarie University Climate Impacts Centre home page for a map showing climate zones around the world. It uses a less detailed version of the Köppen classification scheme. The WorldClimate site lists average conditions (mostly temperatures) around the world. Very detailed global climate data is available from the National Climate Data Center in the USA. You’ll find the highest and lowest temperatures recorded in each continent at World Temperature Extremes. |
|
|
|
Of all weather phenomena, clouds are among the most fascinating. From the silky filaments to high altitude cirrus to the towering, threatening mass of storm-bearing cumulonimbus, clouds are as varied as the weather itself. Lean more... |
|
|
|
Weather Conversion Calculators These easy to use calculators will allow you to convert Barometric Pressure, Rainfall, Temperatures and Wind Speed into both metric and imperial readings. Simply enter the figure you know, and it will be converted into the figure you don't! For example, quickly convert rainfall mm's into inches and so on. Lean more... |
|
|
|
El Niño translates from Spanish as 'the boy-child'. Nowadays, the term El Niño refers to the extensive warming of the central and eastern Pacific that leads to a major shift in weather patterns across the Pacific. In Australia (particularly eastern Australia), El Niño events are associated with an increased probability of drier conditions. Lean more... |
|
|
|
What's the hottest temperature ever recorded? What's the worlds windiest or driest place? Is the coldest temperature ever recorded in the Artic or Antarctic? Find out as we explore all the weather facts and figures. Lean more... |
|
|
|
Forecasting the behaviour of the complex fluid that is our atmosphere is a major scientific challenge embracing physics, chemistry and mathematics. Lean more... |
|
|
|
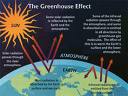
The greenhouse effect is a natural warming process of the earth. Human activities such as deforestation and the burning of fossil fuels have increased the concentrations of greenhouse gases in the atmosphere. Scientists are concerned that higher greenhouse gas concentrations will lead to an "enhanced" greenhouse effect which may lead to global climate change. Lean more... |
|
|
|
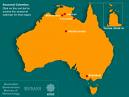
Indigenous Australians have long held their own seasonal calendars based on the local sequence of natural events. Unlike the European spring, summer, autumn and winter, the Indigenous versions include often five, and sometimes seven, distinct seasons. Lean more... |
|
|
|
La Niña translates from Spanish as "the girl-child". The term La Niña refers to the extensive cooling of the central and eastern Pacific Ocean. In Australia (particularly eastern Australia), La Niña events are associated with increased probability of wetter conditions. Learn more... |
|
|
|
Sportspeople have cheered or cursed the weather for at least 2770 years since the Greeks staged the first Olympic Games. Footrunners welcomed a following wind. Archers and javelin throwers monitored breezes as closely in peace as in war, watching the movements of leaves or flags. Charioteers battled mud, dust or heavy rain. Learn more... |
|
|
|
Ozone is a pale blue gas irritating to the nose and throat; it is explosive and toxic. It is produced and destroyed naturally in the atmosphere and until recently, this resulted in a nicely balanced equilibrium. It is formed when oxygen molecules absorb ultraviolet radiation with wavelengths less than 240 nanometres and is destroyed when it absorbs ultraviolet radiation with wavelengths greater than 290 nanometres. Learn more... |
|
|
|
This page provides links to information about past significant weather events such as tropical cyclones and severe thunderstorms, as well as links to online fact sheets, brochures and reports. Learn more... |
|
|
|
An important component of the Australian Bureau of Meteorology's Severe Thunderstorm Warning Service is a national network of volunteer Storm Spotters who provide "on-the-spot" information on damaging storms. There are currently over 2000 Storm Spotters active in Australia. Learn more... |
|
|
|
We know that to some extent, cities create their own climate. Studies show that when a landscape of plants and soil gives way to one of bricks and concrete, the local climate changes along with the scenery. Learn more... |
|
|
|
The weather map is one of the most familiar images in the community. The best known map is the mean sea level analysis, compiled from hundreds of weather observations (synoptic data) taken simultaneously around the Australian region. It is seen daily on television and in the newspapers. Lean more... |
|
|
|
Meteorologists preparing weather forecasts and warnings compress a lot of information into standardised, brief messages. Their predictions for electronic media and newspaper 'headline' forecasts must be particularly concise. Lean more... |
|